 BambooForge Labs

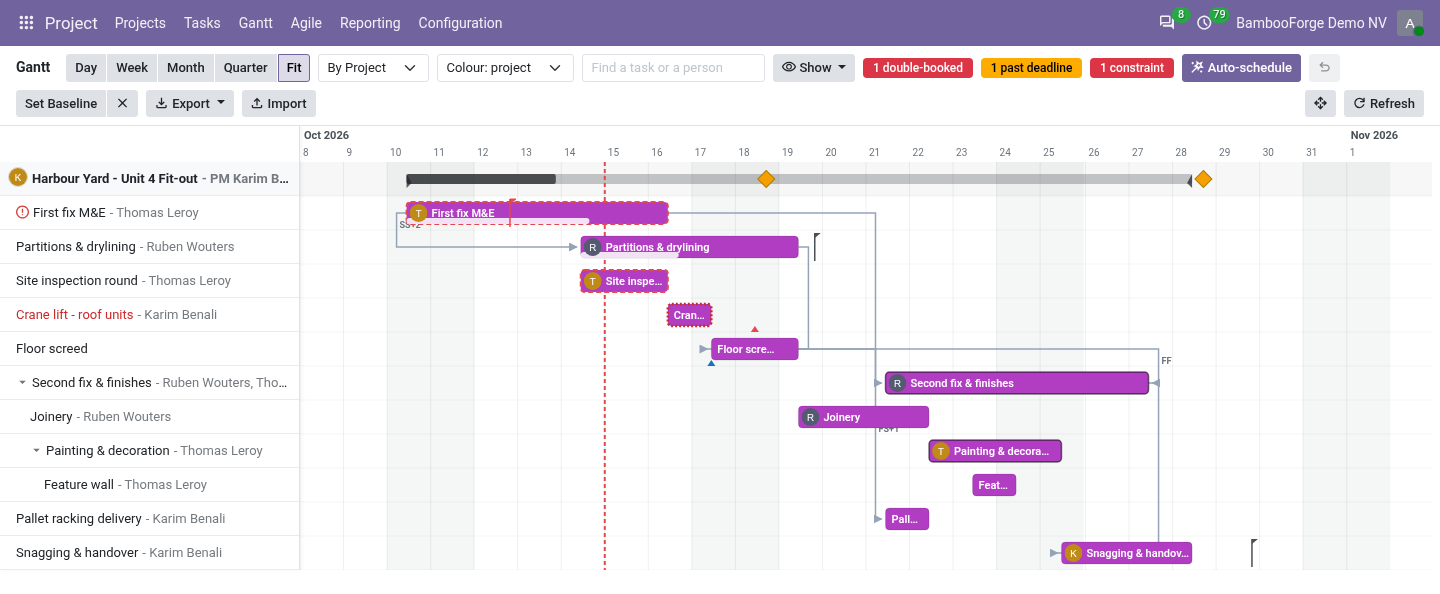
- Plan by draggingA bar moves by whole days; the tasks waiting on it are pushed by their link and lag, never before their own fence.
- Start and finish constraintsStart No Earlier Than, Must Finish On and the rest; Auto-schedule packs the open tasks and lists what it cannot honour.
- Files both waysMS Project XML, Excel and CSV out and in, a printed PDF schedule and a PNG of the chart.
Runs onOdoo 16 to 20Community or Enterprise, self-hosted or Odoo.sh
NeedsProjectno Enterprise module
Price249 EURone-time, per series, on the Odoo Apps Store
Demodemo20.bambooforge.devlogin page already filled in
Supportsupport@bambooforge.devfirst reply within one business day
Version20.0.2.0.3
bambooforge_gantt85 automated checks run before every release of this app, the same suite on every series it ships for. The complete list is in the source you receive; run it yourself with --test-enable.
How you use it
From a list of tasks to a plan
Flow 01
Draw the links
For the planner.
- Drag the circle at the end of a bar onto another bar: it now waits on the first.
- On the task's Schedule page, change the type or add a lag in working days.
- A loop is refused with both tasks' names.
Flow 02
Schedule and fence
For the planner.
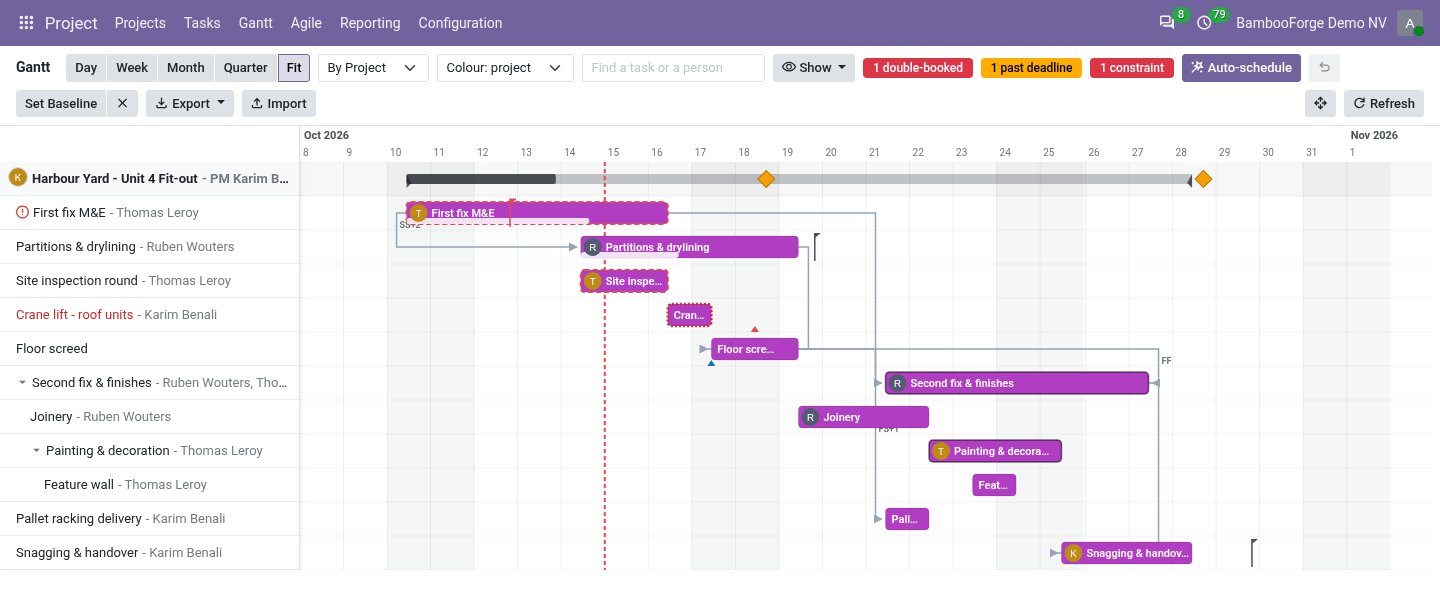
- Give a task a constraint and its date: no earlier than, no later than, or exactly on.
- Auto-schedule places every open task as early as its links, constraint and working days allow.
- A banner lists what could not be honoured; a red pin marks it on the bar.
Flow 03
See what decides the end
For the project manager.
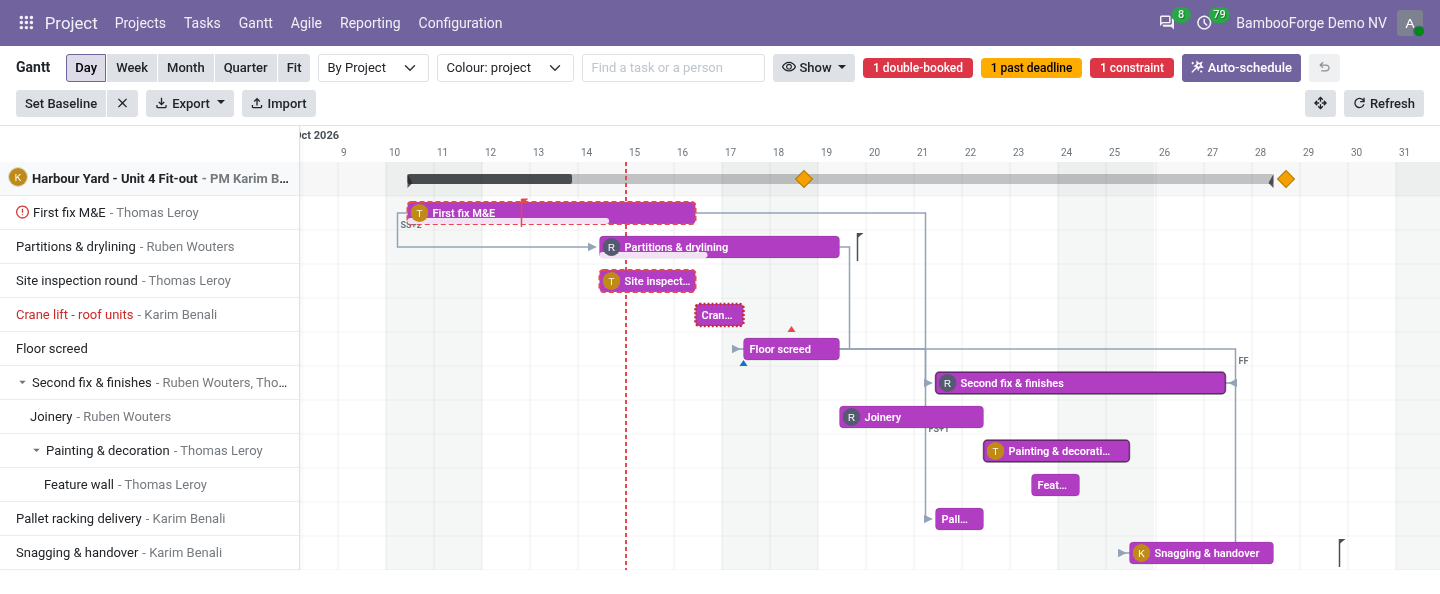
- Tick Critical path: the chain with no float turns red.
- Every linked task's tooltip gives its float in days.
- Set Baseline, then tick Baseline: the slip of each task in days.
Flow 04
Balance the people
For the team lead.
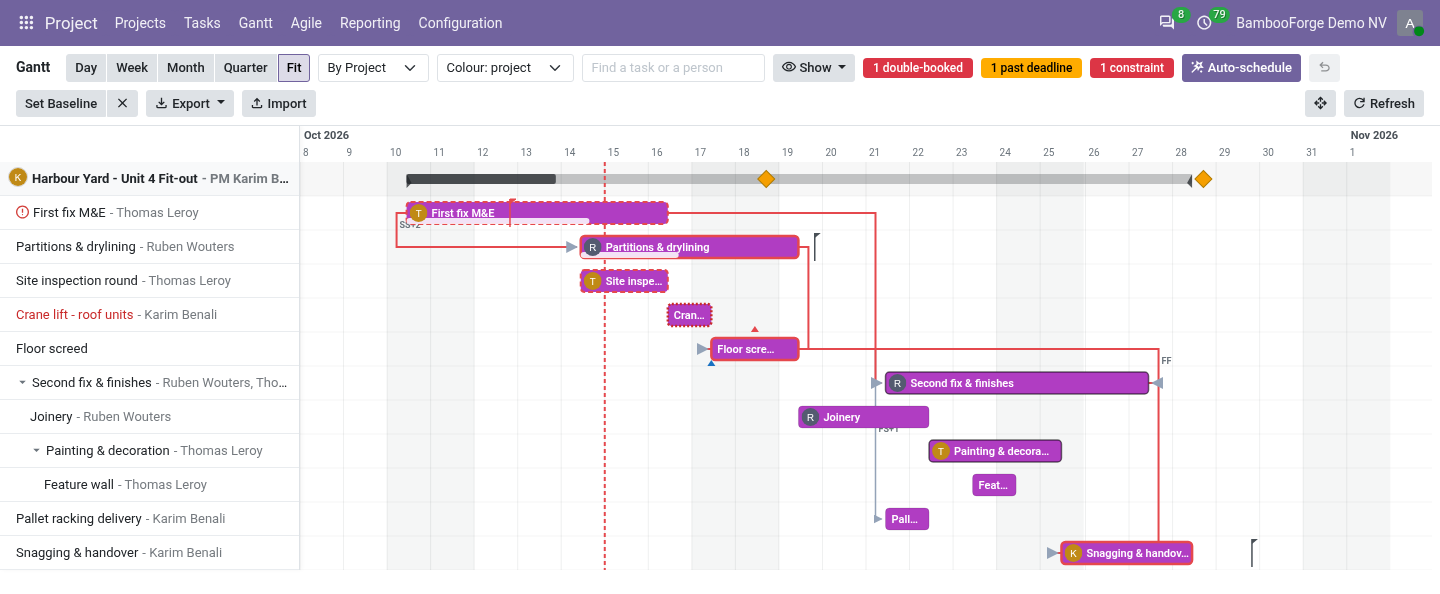
- Group by assignee to see each person's tasks.
- Tick Workload: hours a day against the company calendar, red when over.
- Double-bookings get a warning stroke and a count in the toolbar.
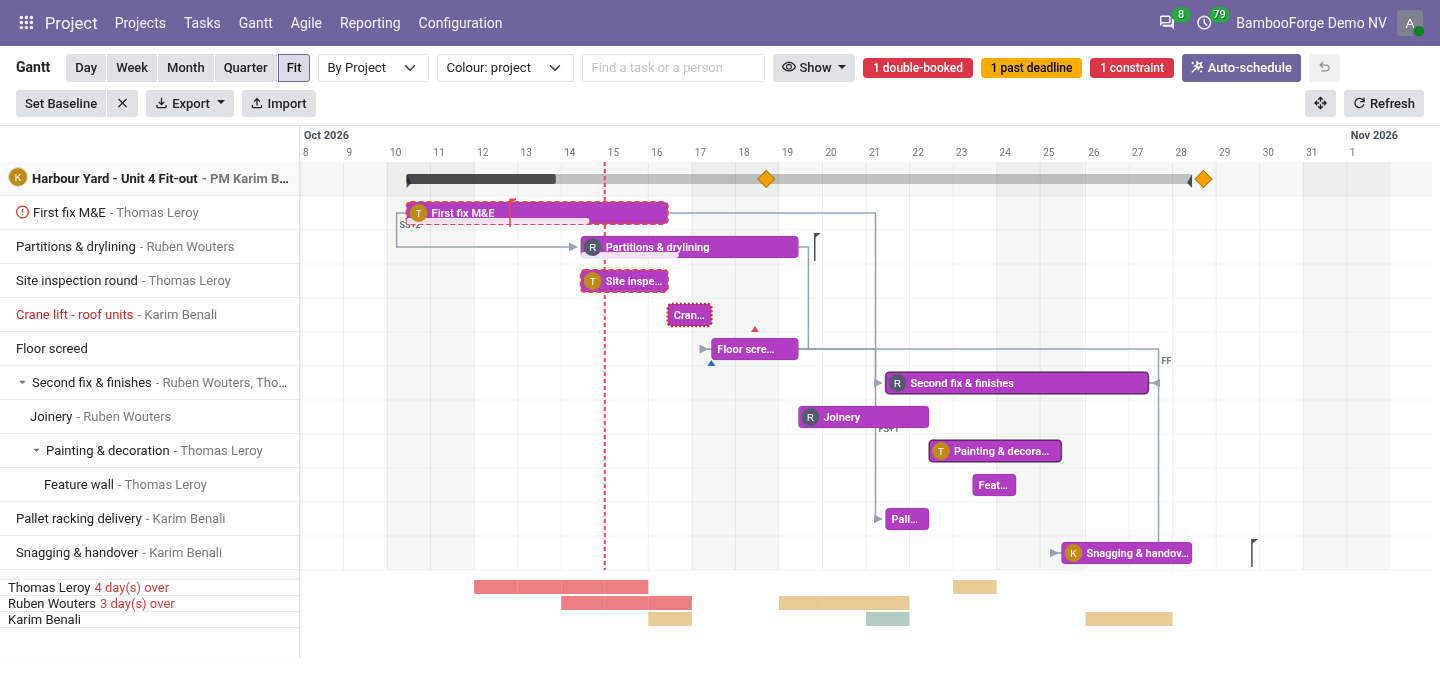
Flow 05
Plan in and out
For whoever reviews the plan outside Odoo.
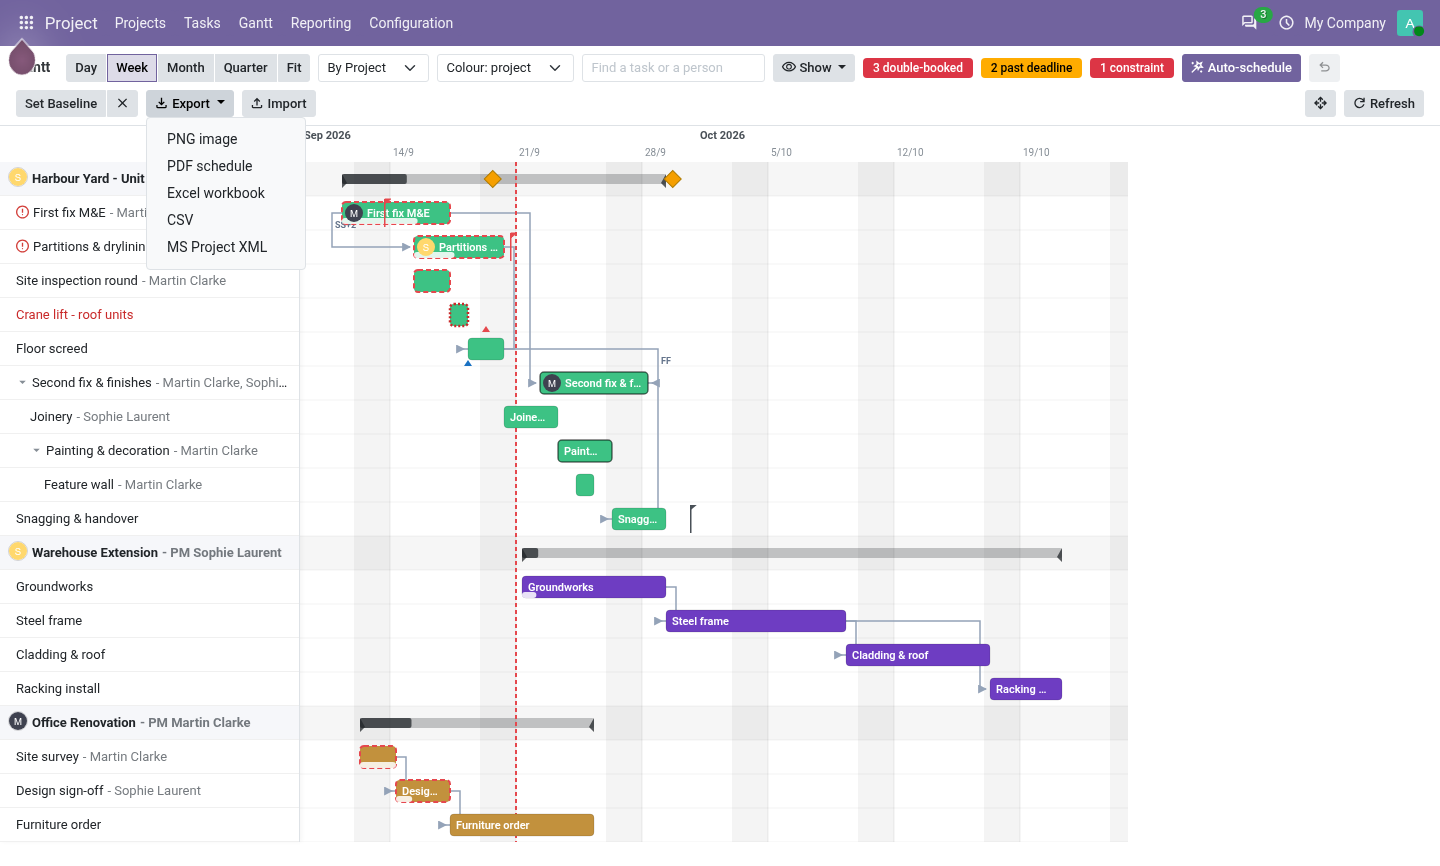
- Export the chart's tasks to Excel, CSV or MS Project XML, or print the PDF schedule.
- Import an MS Project, Excel or CSV plan into a project: rows become tasks with their links.
- A row with a task's name updates that task.
Price and where to buy
249 EUR, one payment per Odoo series, on the Odoo Apps Store. Pick your series:
Twelve months of support by the people who wrote the code; bug fixes and improvements within the series free for as long as it is published. Report a bug within two months of purchase and, if it is not resolved within fifteen days, you get a full refund. Full source under OPL-1, no licence key, no phone-home. The whole promise.