 BambooForge Labs

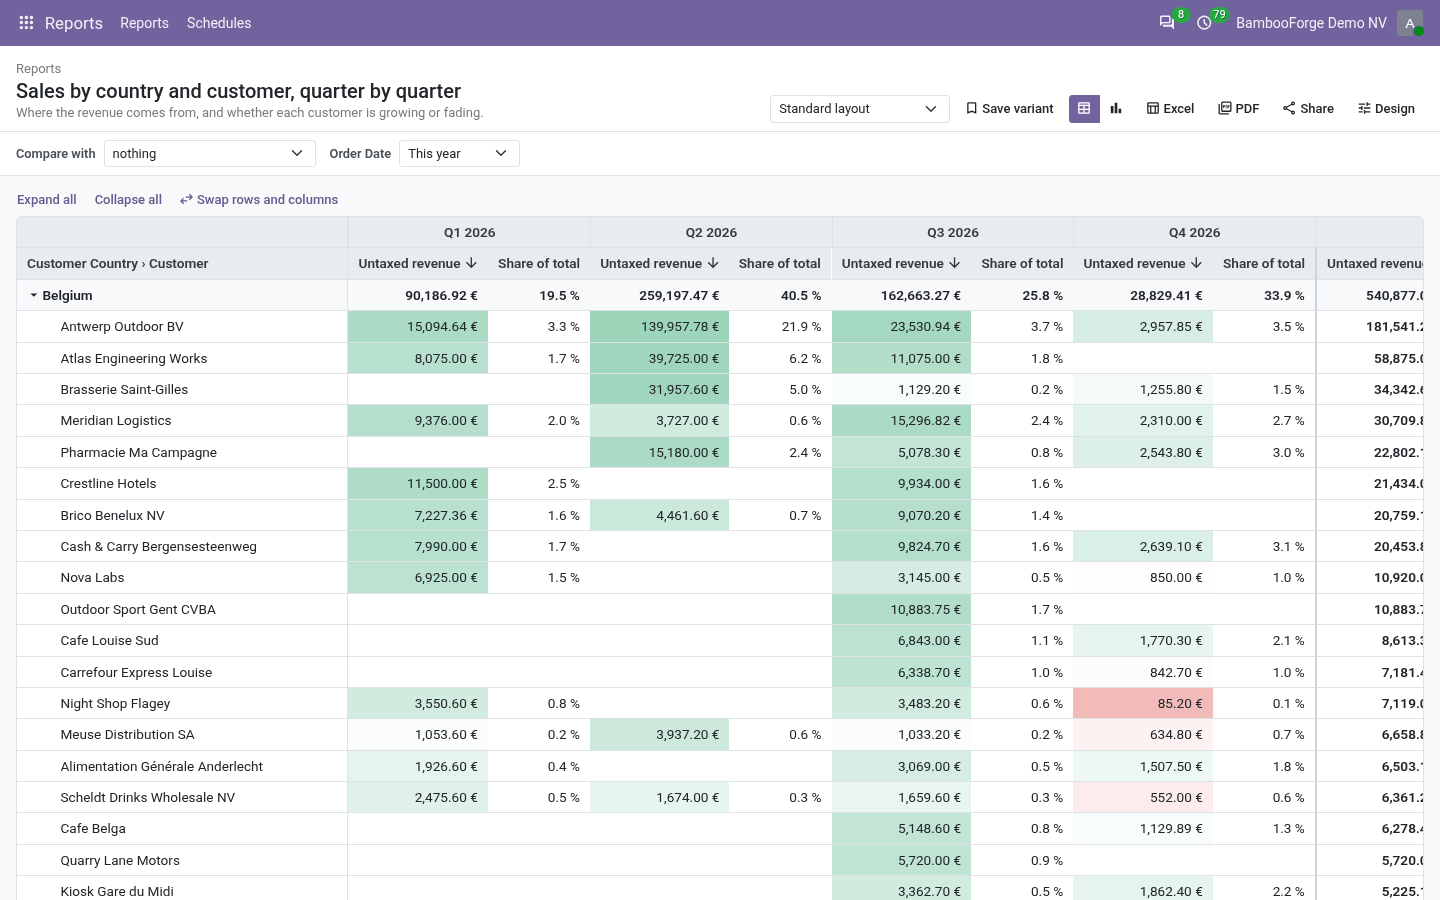
- Tables that nest and crossUp to five row levels and two column levels, on any model. A report follows links from an order line to its order, its customer and the customer's country. Sums, true averages and distinct counts are right at every level.
- Every reader keeps a view of their ownRegroup, re-sort, change the period and press Save variant. A variant is yours, private or shared, and the report can open with it. The standard layout stays what the designer made.
- Excel, PDF, email and a linkExcel that folds where the screen does, PDF, a schedule that emails both once per day, week or month, and a share link for somebody without a login.
bambooforge_report_builder49 automated checks run before every release of this app, the same suite on every series it ships for. The complete list is in the source you receive; run it yourself with --test-enable.
How you use it
From a ready report to one of your own
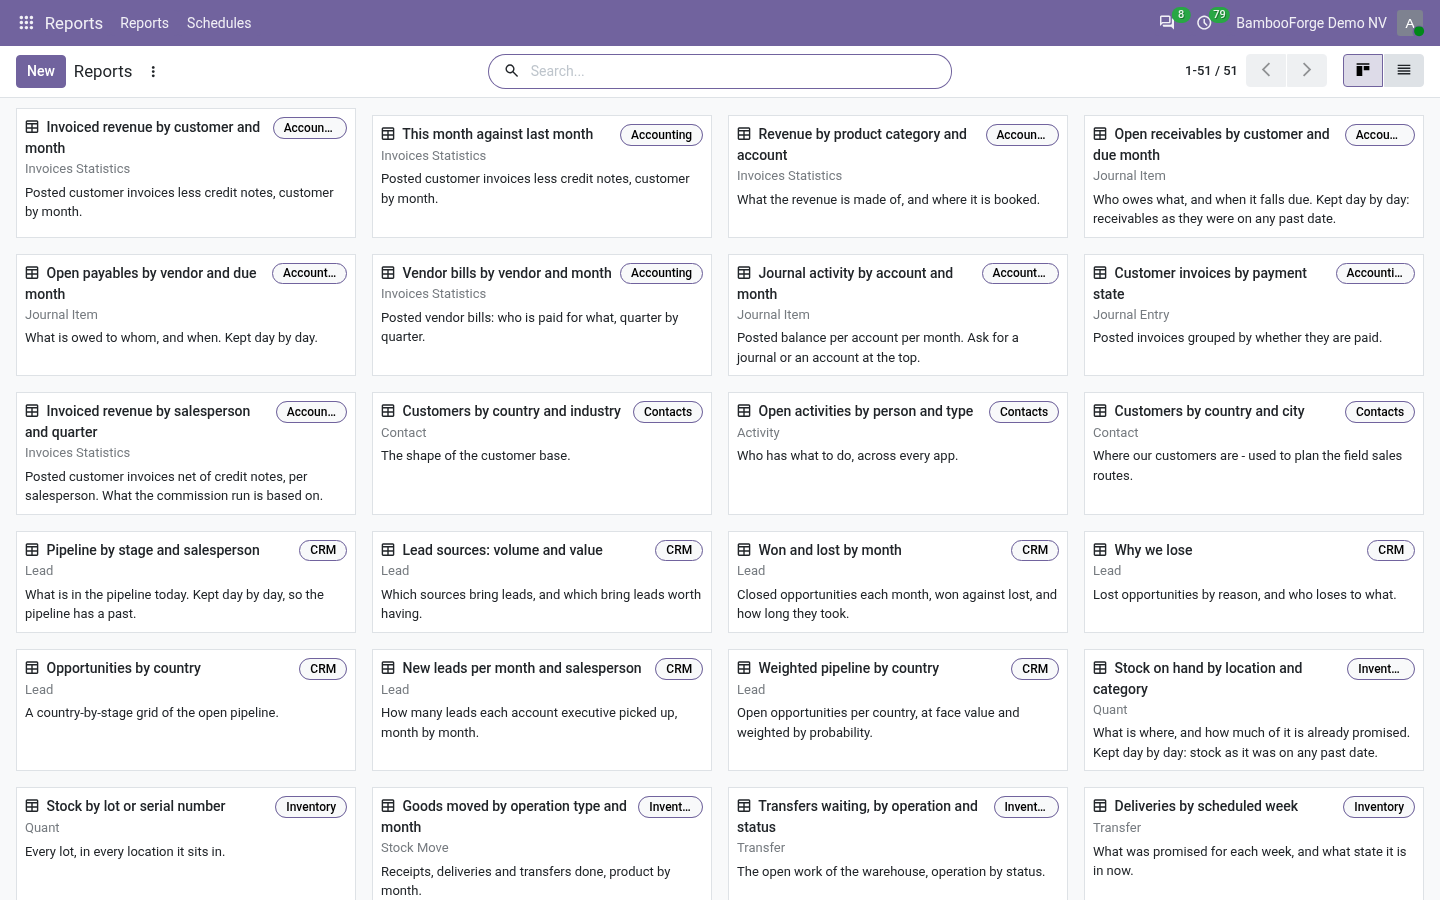
Start from the gallery
The list is not empty on the first day.
- Open Reports: every gallery report whose app is installed is there, out of 42 for Sales, CRM, Accounting, Inventory, Purchase, Manufacturing, People, Project, Point of Sale, Contacts and Events.
- Install another app later and choose Reports > Load the report gallery: its reports arrive, and nothing you already have is touched.
- Archive a gallery report you do not want. A deleted one comes back with the next load.
Read it, compare it, keep your layout
Every reader counts only what their own access lets them read.
- Fold and unfold rows, and click a column heading to sort by it.
- Click any number to open the records it counts, with its row, its column and your answers applied.
- Answer the questions under the title: a period, a customer, a status.
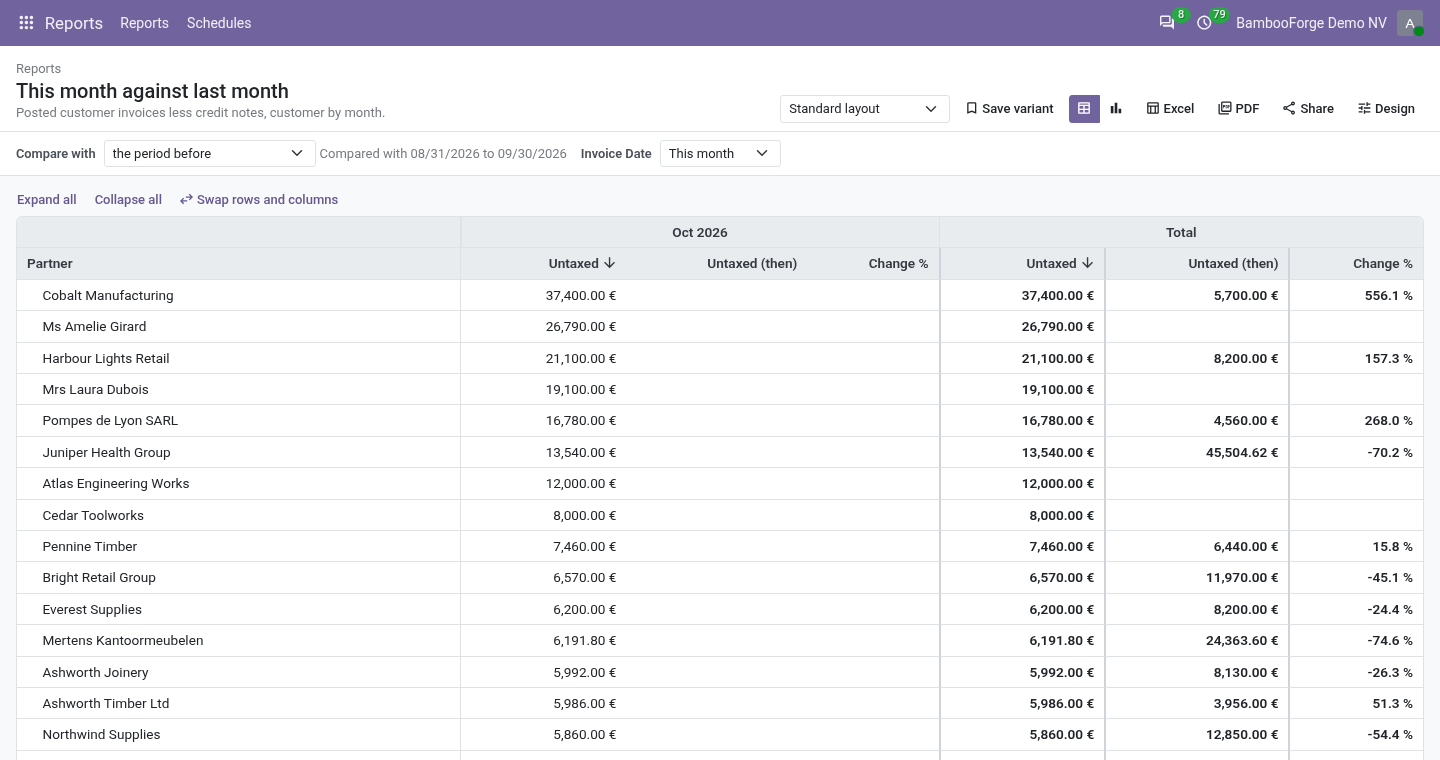
- Choose Compare with: the period before, or the same period a year before. Every number gets its value then and the change in percent.
- Press Save variant to keep the layout under a name, private or shared.
Design a report
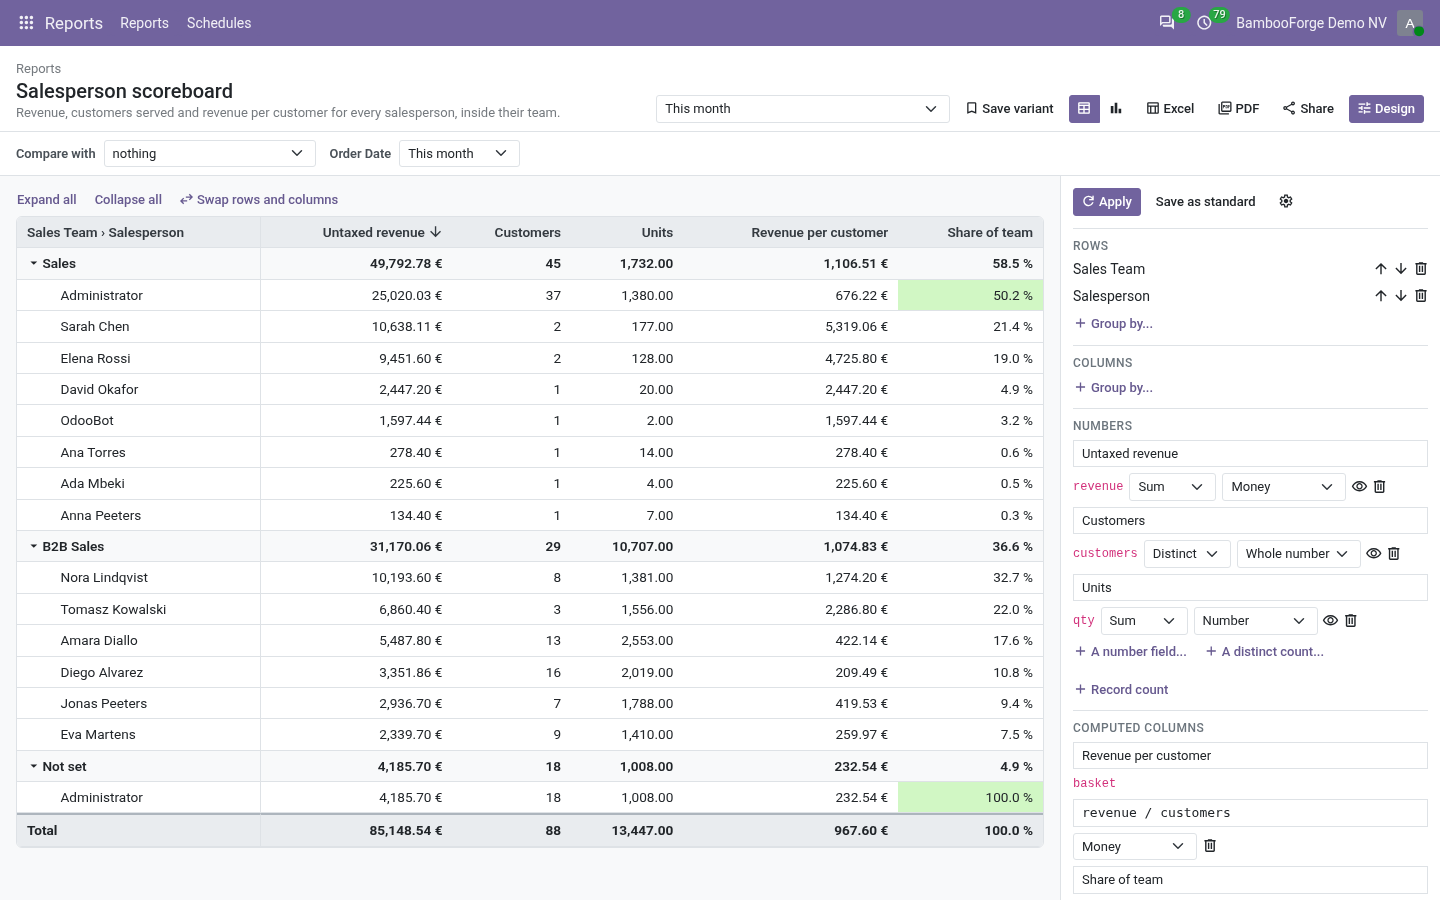
For a Report Designer, in a panel beside the live table.
- Open Reports and press New: a name, the kind of record it reads and, if not every record counts, a filter.
- Press Open Report, then Design. Group rows and columns by a field, or follow a link up to two links away.
- Add numbers, distinct counts and the record count, and computed columns in arithmetic with total(), parent(), row() and prev().
- Add highlight rules or a colour scale, and the questions the reader is asked.
- Press Apply to see it, and Save as standard when it is right.
Follow a balance day by day
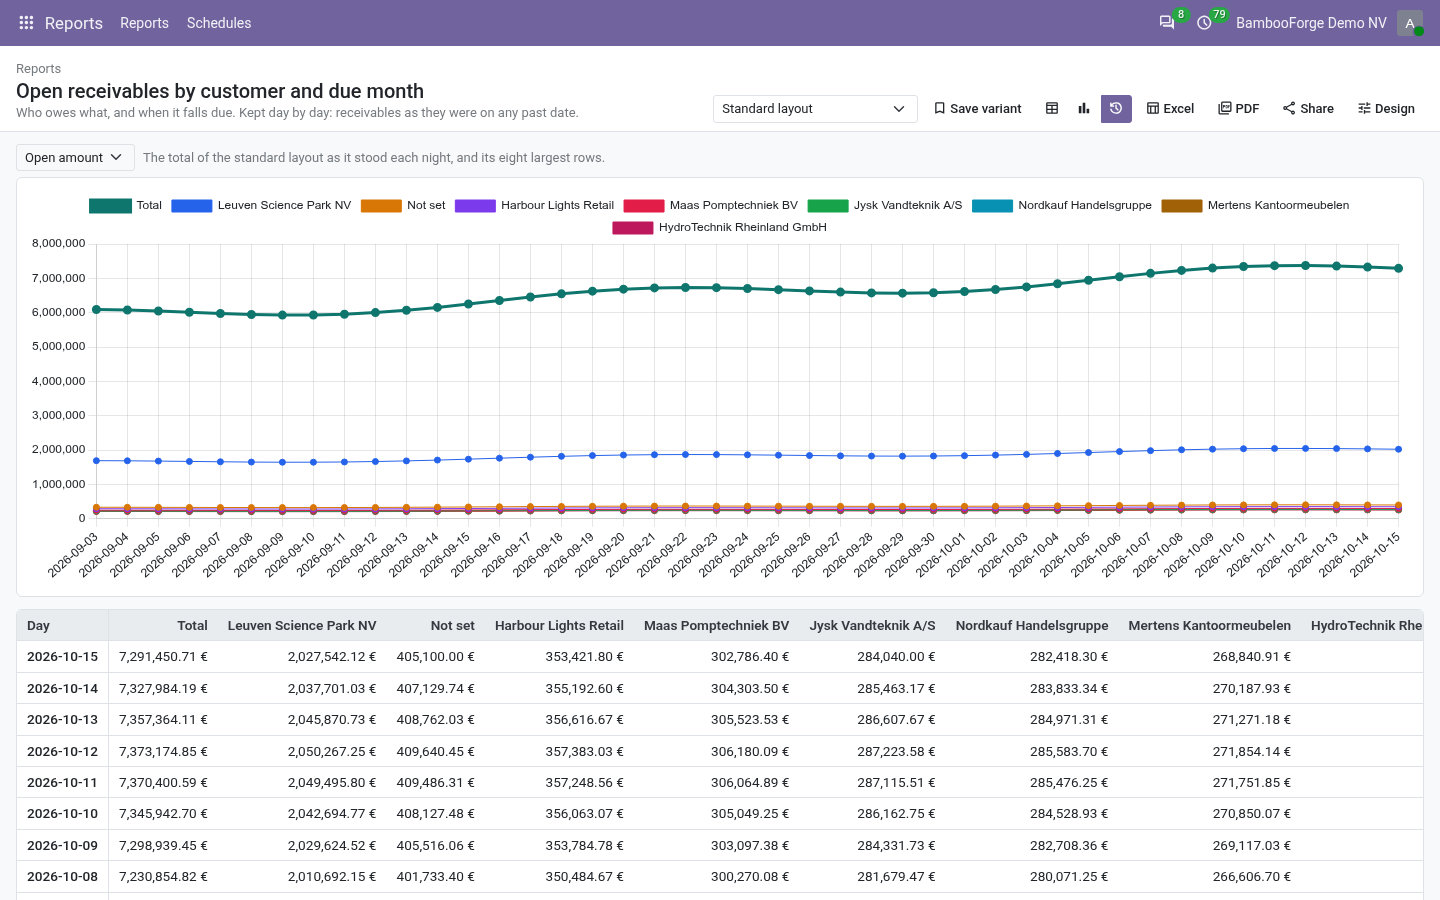
Odoo knows your stock and your receivables today. A history keeps what they were.
- Tick Keep a Daily History on the report.
- Every night at 01:00 UTC its grand total and up to 200 first-level rows are written down.
- The Day by day button shows the total and the eight largest rows, as a chart and as a table.
- Write Today's History on the report form takes an entry at once.
Share it with somebody without a login
An accountant, a partner, a board member.
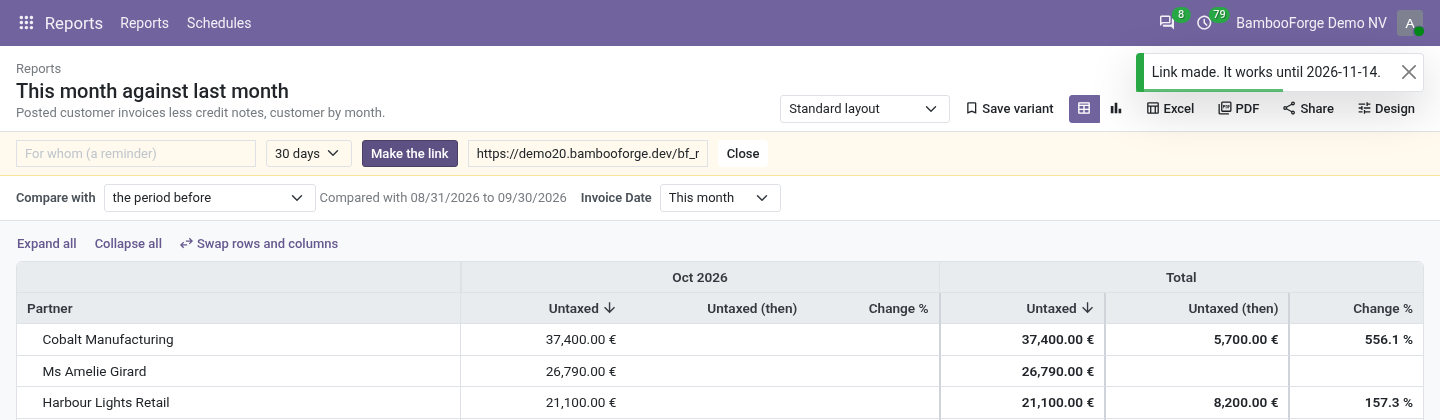
- Press Share, note who the link is for and choose 7, 30 or 90 days or a year.
- Press Make the link and send the address.
- The visitor sees the report as laid out then, computed again at each visit with your access, and nothing else of Odoo.
- The report's form lists the links with their views, and Withdraw ends one.
Price and where to buy
129 EUR, one payment per Odoo series, on the Odoo Apps Store. Pick your series:
Twelve months of support by the people who wrote the code; bug fixes and improvements within the series free for as long as it is published. Report a bug within two months of purchase and, if it is not resolved within fifteen days, you get a full refund. Full source under OPL-1, no licence key, no phone-home. The whole promise.