 BambooForge Labs
Dashboard Builder: Drag-and-drop KPI Dashboards
Drag-and-drop KPI dashboards with charts and targets, threshold alerts that email the people who care, and scheduled PDF snapshots.
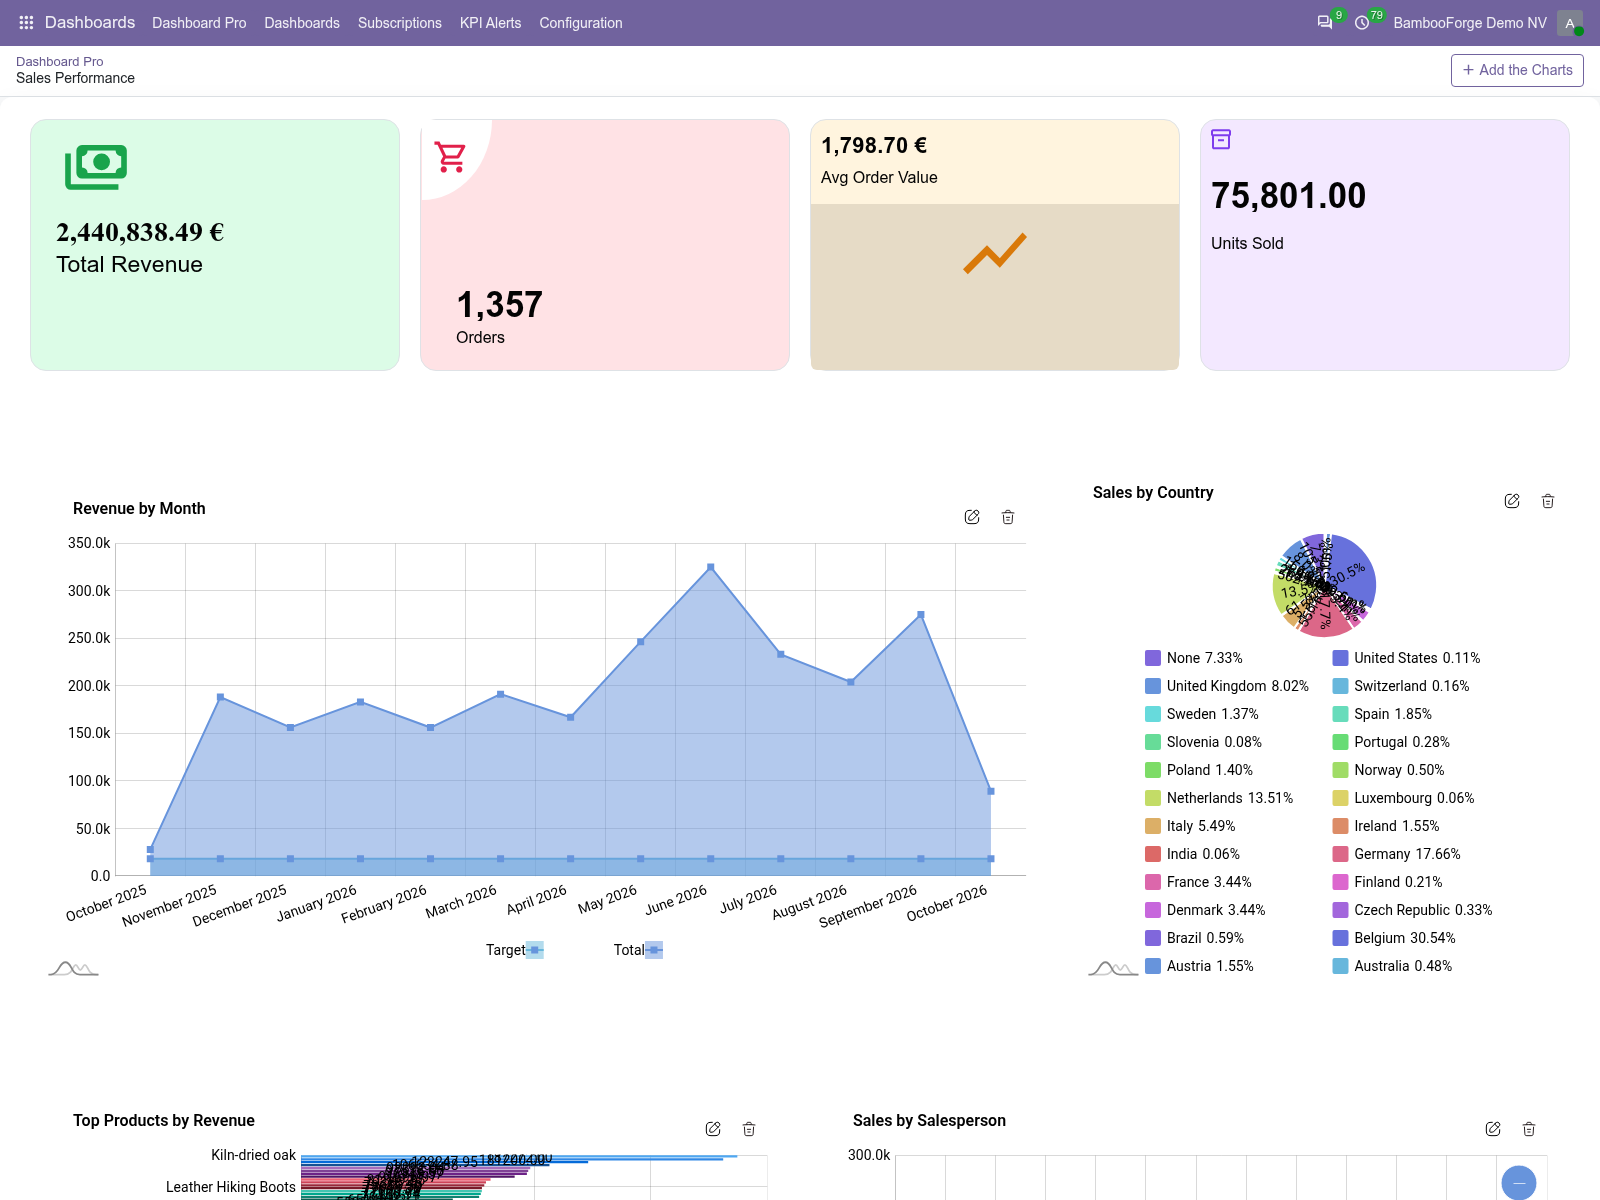
Build live operational dashboards inside Odoo 20 without writing code: drop in tiles, charts, KPIs and lists that read straight from any Odoo model, group and measure the data the way you want, drag the tiles into place, then set targets and share the board with the right people.
- A tile, a KPI or a chart shows nothing
- No record matches the item's Domain inside the period of the board's date filter. Set the filter to All Time, widen the domain, and check that Date Filter Field is a field these records fill in.
- A chart stays empty although the model has records
- It has no Group By, or a date Group By without a Group By Type. Pick the field to group by and, for a date, the step.
- A click on a chart opens nothing
- The chart has no drill-down level left and Show Records is not ticked on its form, or Edit Layout is on: clicks arrange the items then. A row of a list item is not a link.
Report Builder Pro with Pivot, Drill-down and Excel Export
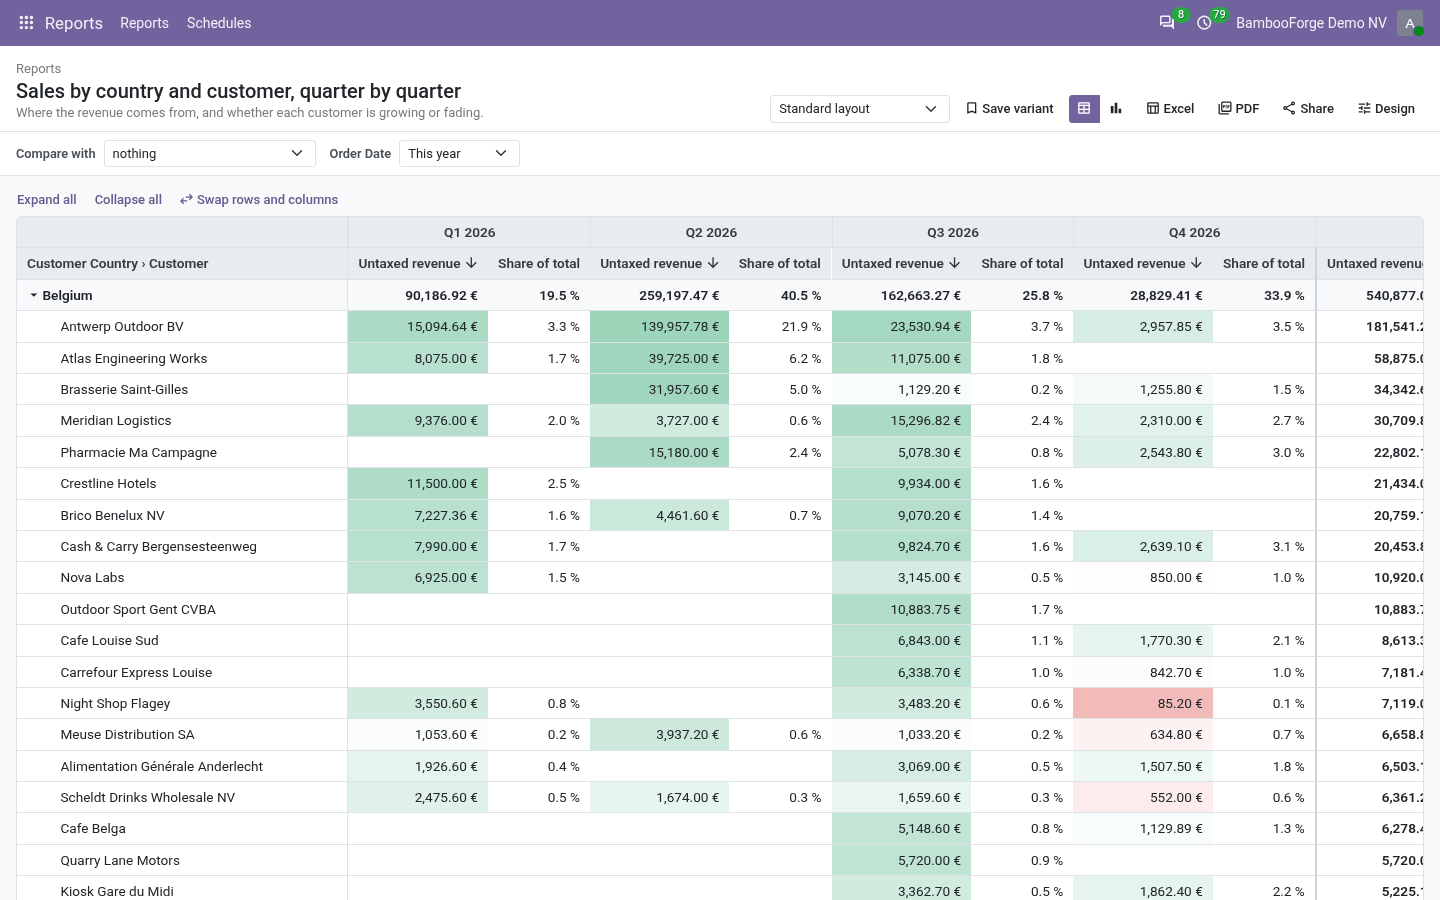
Nested pivot and cross-tab reports on any model, without code: follow links between records, add computed columns, highlight what matters, click any number to open its records, keep your own variants, export to Excel and PDF, email on a schedule. 42 ready reports and a daily history of balances.
Odoo's pivot answers one question at a time and forgets the answer. This app builds reports: tables that nest up to five levels deep, run a second field across the top, follow links from one record to the next, work columns out from other columns, highlight what matters and open the records behind any number. Every reader can bend a report and keep the result as a variant of their own.
- A report stopped writing its history after an upgrade.
- Its history was taken as OdooBot, the system user, which counted every company and skipped every access rule. Open the report, name a person under History Taken As and save: the history goes on that night with that person's access.
- "Name a person under History Taken As first."
- Write Today's History on a report nobody is named on. Pick the person whose access the history should be taken with.
- A week row does not start on Monday.
- A week is the week of your language: it starts on its First Day of Week (Settings > Languages), Sunday for English (US). The row counts those seven days, carries the week number Odoo's own lists give them and opens exactly them.
Financial Dashboard All in One with KPI Tiles
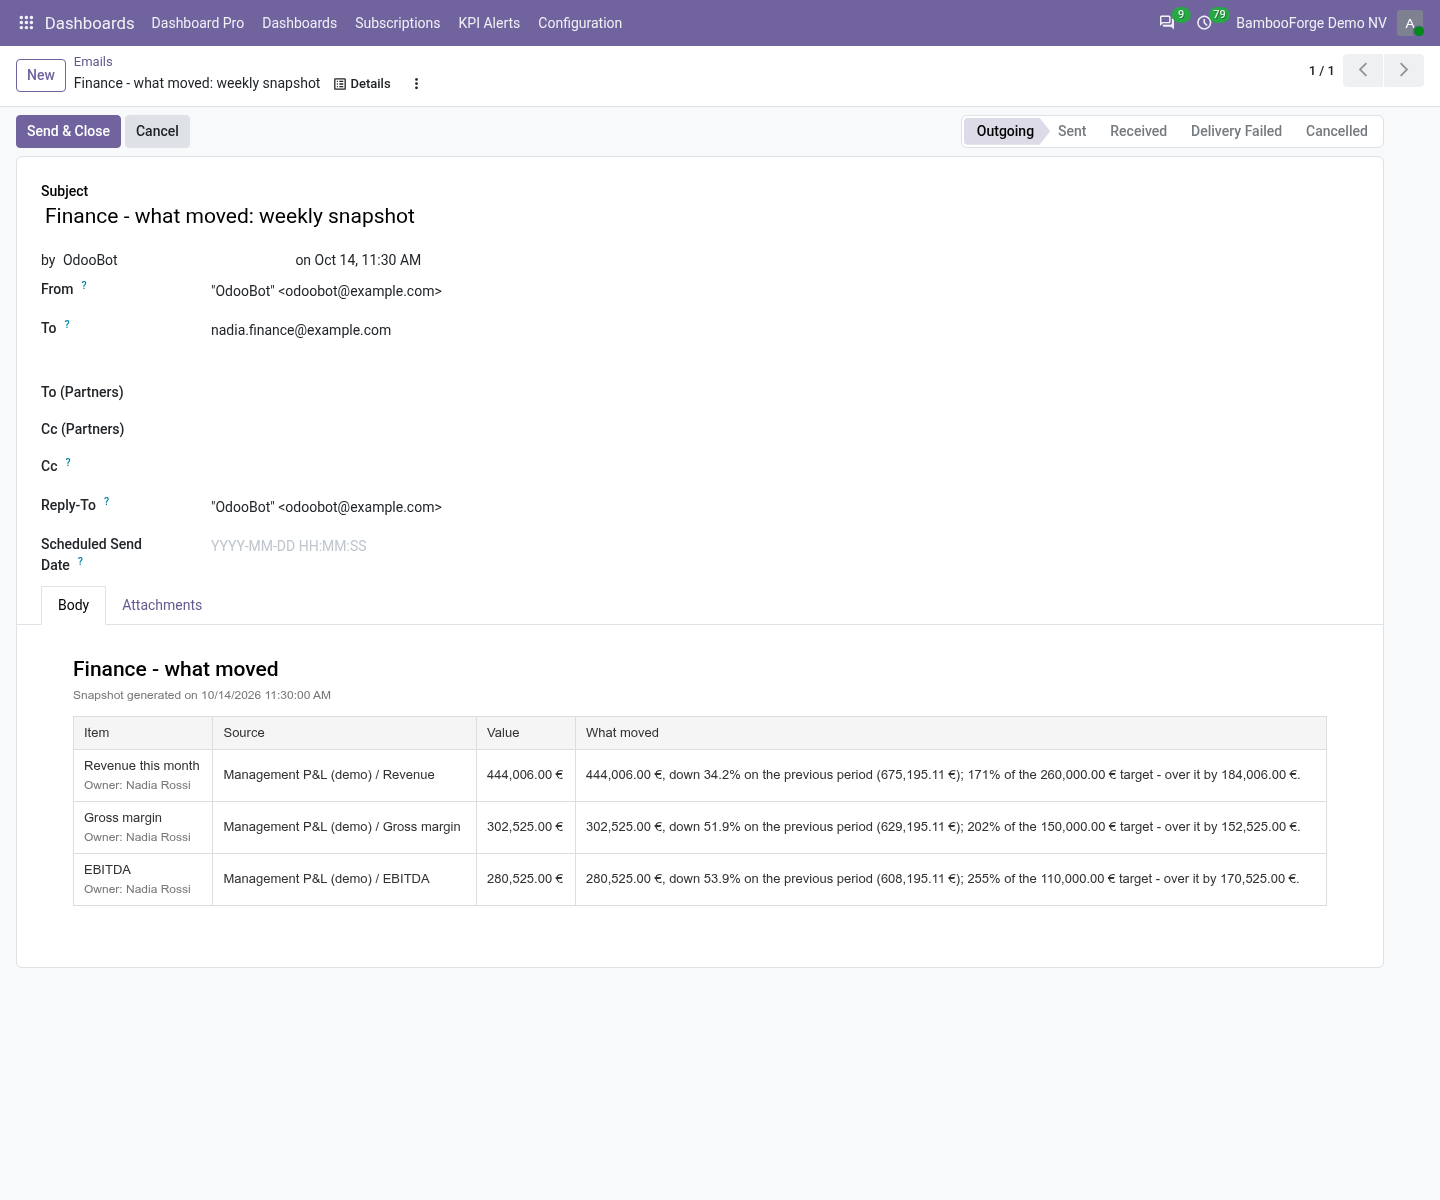
Put any line of a Financial Reports Builder statement on a Dashboard Builder board as a tile or a KPI - gross margin, EBITDA, cash - over the board's own date filter. A KPI adds a previous-period comparison, a target, a named owner and a sentence that says what moved, in the alert e-mail and in the scheduled snapshot.
Dashboard Builder draws numbers from any model. Financial Reports Builder computes the numbers finance actually reports on. This bridge puts a statement line on a board and tells you, in one sentence, what moved.
- Data Type is not on the form
- It shows once a Model is picked. Pick any model: choosing Financial report line then sets it to Journal Item.
- "A financial-report item needs a report and a line"
- Data Type is Financial report line and the report or the line is empty. Pick both. On a chart, which has no such fields, choose another Data Type: a statement line goes on a tile or a KPI.
- "Line... does not belong to..."
- The Report line is from another statement than the Financial report. Pick the line again after changing the report.
Report Builder on Dashboards: a Report's Total as a Tile
A dashboard tile or KPI can show the grand total of any Report Builder report, with its fixed conditions and questions as saved. It installs by itself once Report Builder and Dashboard Builder are both there.
A report built with Report Builder already holds a number: the records that count, its fixed conditions, the answers saved with it and its computed columns. This add-on lets a tile or a KPI of Dashboard Builder show that number, the grand total of one column of the report. One number, defined once.
- "... takes its number from a report: pick the report."
- The item's Data Type is A Report Builder total and no Report is chosen. Pick one, or choose another Data Type.
- "... has no column...; it has..."
- The key under Column is not one of the report's. Copy a key from Columns Available, or empty the field for the first visible column.
- The tile shows 0.
- The reader may not open the report or read its records, the report was deleted, or the key under Column belongs to a number that is hidden in the report's design. Check Visible To on the report, and choose a column from Columns Available.
Other questions we answer
Odoo access control: who can see whatAudit trail for OdooPrint from Odoo without an IoT boxShopify and Odoo in syncWooCommerce and Odoo in syncPrestaShop and Odoo in syncConnect Odoo to n8n, Make and ZapierPeppol e-invoicing in OdooE-invoice checks before an invoice leaves OdooDocument management in OdooFinancial statements on Odoo CommunityGDPR and cookie consent for OdooApproval workflows in Odoo CommunityQuality management for ISO 9001 in OdooAI translation for an Odoo website and catalogueOdoo for a dental clinicOdoo for a hotelOdoo for a restaurantOdoo for a garage or used-car dealerOdoo for construction: BoQ and job costingSubscriptions and recurring invoicing on Odoo CommunityHelpdesk for Odoo CommunityField sales on a phone with Odoo